In this tutorial I’ll show you what is ROS rqt plot and how to use it efficiently, through some examples.
Table of Contents
What is rqt plot and what to do with it
Rqt is a very useful ROS tool to help you during your ROS development. It’s based on the Qt framework and includes a lot of plugins. In this post we’ll focus on the rqt_plot plugin.
With rqt_plot you can plot (what a surprise) any numeric values published by ROS topics. You can also have multiple plots on the same graph.
That’s great to visually monitor the data created by a node or multiple nodes. For example, you could plot the position/speed/acceleration of your mobile base to see if there is any jerk and if the trajectory is smooth. You could monitor the temperature sensor data to see any rising value, etc.
Install rqt plot
If you have already installed the “Desktop” or “Desktop-Full” version of ROS (see the installation guide from ROS Wiki), rqt should already be installed. As I explained above, rqt plot is a part of Rqt.
Here’s the package to install for rqt:
You are learning ROS?
Check out ROS For Beginners and learn ROS step by step.
$ sudo apt install ros-melodic-rqt
After that make sure to run source ~/.bashrc. Your .bashrc file should already contain the command line source /opt/ros/melodic/setup.bash.
Launch rqt plot
To start any rqt plugin you first need to get a ROS master running. Execute roscore in a terminal.
Then to start rqt_plot, you can run either
$ rosrun rqt_plot rqt_plot
Or directly
$ rqt_plot
When you install Rqt there is an executable created for some of the plugins. Basically the rqt_plot executable will just start the rqt_plot node from the rqt_plot package, just like we did with the “rosrun” command.
If you want to dig deeper and see where is the executable, use the “which” command line tool:
$ which rqt_plot
/opt/ros/melodic/bin/rqt_plot
When you start rqt_plot (with rosrun or the executable), an anonymous node is created, you can find it using rosnode list:
$ rosnode list
/rosout
/rqt_gui_py_node_18748
Thus you could create multiple rqt_plot windows if you wanted to, by starting a rqt_plot node in different terminals. For this tutorial we’ll use only one window, in which we’ll plot multiple topics.
Note: if you try to launch rqt_plot without a running ROS master, you’ll get an error similar to this
$ rqt_plot # no roscore started
PluginManager._load_plugin() could not load plugin "rqt_plot/Plot": RosPyPluginProvider._init_node() could not find ROS master
Plot topic values with rqt_plot
Before we can plot anything, let’s create a basic node with a publisher. In this tutorial I’ll use Python only, the goal is to show you how to use rqt_plot and not to spend too much time on the code itself.
import rospy
from std_msgs.msg import Int64
import random

if __name__ == '__main__':
    rospy.init_node("random_number_publisher")
    pub = rospy.Publisher("/random_number", Int64, queue_size=10)

    # publish on topic at 10Hz (+ lien)
    rate = rospy.Rate(10)

    while not rospy.is_shutdown():
        # this will generate a random number
        # between 0 and 9
        random_number = random.random() * 10
        pub.publish(random_number)
        rate.sleep()
This code will simply publish a random number – between 0 and 9 – at 10Hz, on the “/random_number” topic.
Visualize your topic data with rqt_plot
After you’ve started a roscore, in another terminal execute this script (either directly with python or with rosrun).
Check out the running topics to see your new topic:
$ rostopic list
/random_number
/rosout
/rosout_agg
Let’s check the data coming from this /random_number topic:
$ rostopic echo /random_number
data: 3
---
data: 8
---
data: 1
---
data: 7
---
data: 0
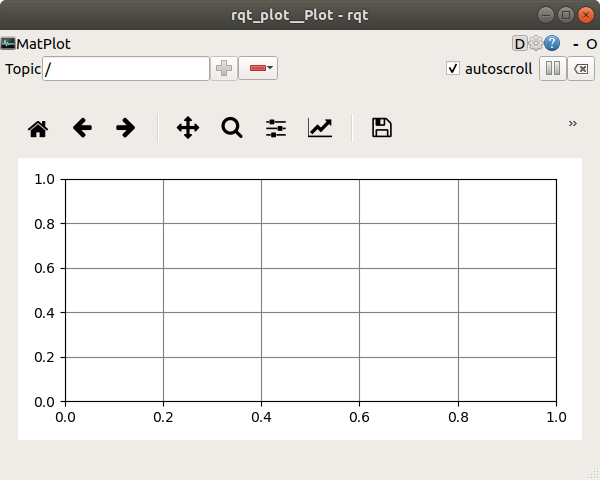
OK, now comes the interesting part. Let’s actually plot those values with rqt_plot. From now, for simplicity, I’ll only use the rqt_plot executable instead of rosrun rqt_plot rqt_plot.
You can directly give the topic name as a parameter in the rqt_plot command line
$ rqt_plot /random_number

Don’t forget to click on the “autoscroll” checkbox so you can see the evolution of the values.
Change the rqt_plot settings
Maybe the axis on the plot are not correctly set up, or you want a bigger x range to see more data. You can modify all that with the available settings options.
![]()
Click on this icon above to modify the x and y axis settings.
In this case I’ve set X from 0 to 10 so we can see a 10 seconds window. As the autoscroll option is checked, this window will automatically adjust to show the latest available data.
I’ve also set the Y axis to show values between 0 and 10, as the published data on the topic is between those 2 numbers.
Take a few seconds to experiment on the different rqt_plot settings. They are pretty easy to use. With the 2 arrows icons on the toolbox, you can switch between different view settings.
Plotting 2 topics on the same graph with rqt_plot
Let’s create another publisher so we can visualize two plots on the same window.
Create a sinus publisher
Create a new Python file for a new ROS node.
import rospy
from std_msgs.msg import Float64
import math

if __name__ == '__main__':
    rospy.init_node("sinus_publisher")
    pub = rospy.Publisher("/sinus", Float64, queue_size=10)

    x = 0
    rate = rospy.Rate(20)

    while not rospy.is_shutdown():
        # Increase the value by 0.1 rad
        x += 0.1
        # Multiply the sinus value by 10
        # so it's nicer for the plot example
        pub.publish(math.sin(x) * 10)
        rate.sleep()
The structure of the code is the same as for the random number publisher. Here we publish data on the /sinus topic at 20Hz. The sinus value will be between -1 and 1, and we multiply it by 10, so we have a value between -10 and +10.
As you can see, here we don’t publish integer numbers, but float numbers. As long as it’s a number, you can use rqt_plot it without any problem.
Run this node and plot the topic data with rqt_plot
$ rqt_plot /sinus
If needed, adjust the axis min and max in the window settings.
Plot 2 topics with rqt_plot
Let’s keep this window open and add the data from /random_number.
To do so, first, launch the random_number_publisher node in another terminal.
In the rqt_plot window, on the top text input box, write “/random_number” and press ENTER.
You’ll see both topics plotted on the screen.
Note that the data used from the /random_number topic is in fact /random_number/data, and the data used for the /sinus topic is /sinus/data.
If you look at the message definition for std_msgs/Int64 and std_msgs/Float64, you’ll see that they have a field named “data”. You can’t just print a topic, you need to print one of the specific fields that corresponds to a number. In this example, the only possible field is “data”.
In the input text box, when you typed /random_number, rqt_plot automatically chose /random_number/data, as you can see on the graph legend.
rqt_plot with Turtlesim
With rqt_plot you can plot any number data coming from any topic. Let’s use one of the existing ROS package, Turtlesim, and see what data we can plot.
After starting a roscore, launch the turtlesim node.
$ rosrun turtlesim turtlesim_node
Launch the teleop node so you can control the turtle on the screen with your keyboard.
$ rosrun turtlesim turtle_teleop_key
And now, let’s see which topic data we can use.
$ rostopic  list
/rosout
/rosout_agg
/turtle1/cmd_vel
/turtle1/color_sensor
/turtle1/pose
The /turtle1/pose topic contains information about the current turtle pose in the workspace. What data can we use from there? Let’s find out.
$ rostopic info /turtle1/pose
Type: turtlesim/Pose

Publishers:
 * /turtlesim (http://ed-pc:37099/)

Subscribers: None
$ rosmsg show turtlesim/Pose
float32 x
float32 y
float32 theta
float32 linear_velocity
float32 angular_velocity
OK, it seems that we could monitor any of those fields, as they’re all numbers. Let’s monitor the x position of the turtle.
$ rqt_plot /turtle1/pose/x
If you want to monitor other topics through rqt_plot, just add them from the input text box. Remember to always precise which field you’re monitoring. If you just type “turtle1/pose”, rqt_plot won’t know which field you want to plot. In this case it might create a plot for each of the 5 available fields on the topic (x, y, theta, linear velocity, and angular velocity)
rqt_plot, a nice debugging tool
As you saw in this post, using rqt_plot is not that hard, and you can easily plot one or multiple topic data (only numbers).
This can be really useful for debugging, for example if you want to monitor a position drift on a robot wheel, or if you want to compare two data streams from 2 different sensors, or… anything else you want.
Now that you have the basics, take some time to experiment more with rqt_plot!