Rqt graph is a very useful tool to see what’s going on in your ROS graph. It’s a GUI plugin from the Rqt tool suite.
In this tutorial I’ll show you how to install and use it.
Table of Contents
What is rqt graph
Rqt graph is a GUI plugin from the Rqt tool suite. With rqt graph you can visualize the ROS graph of your application.
On one window you can see all your running nodes, as well as the communication between them. The nodes and topics will be displayed inside their namespace.
Note: you can’t see ROS services in rqt graph, only topics. This is due to the way services have been implemented.
Why using rqt graph
When you develop with ROS you usually organize your work into packages and nodes. As your application grows (more sensors, more actuators, more ways to control your robot, …), so does your code base.
You are learning ROS?
Check out ROS For Beginners and learn ROS step by step.
You’ll have more and more nodes, with more and more communication between them (topics, services, actions). Also, and that’s one of the ROS strengths, you’ll use existing ROS nodes in your application. For example, you could use the move_group node (Moveit) for motion planning, the joy node to get data from a joystick controller, etc.
So, you end up with many nodes and topics, and it might become harder to debug. Using rqt graph will help you mostly for those two things:
- You’ll get a global overview of your system. This is really useful so you can take better decisions for the future new parts of your application.
- When you have a bug somewhere due to communication between nodes, you will be able to easily spot the problem. Maybe a node is not correctly connected to another, or there are 2 nodes publishing on a given topic instead of just one, which is why you get some weird values on the subscriber side.
Install rqt_graph
If you installed the “Desktop” or “Desktop-Full” version of ROS – from the installation guide here – you already have rqt_graph which is a Rqt plugin.
To install rqt:
$ sudo apt install ros-noetic-rqt
After that make sure to run source ~/.bashrc. Your .bashrc file should already contain the command line source /opt/ros/noetic/setup.bash.
Launch rqt_graph
First, you need to have a ROS master running in your environment.
After having launched roscore, start rqt graph with:
$ rosrun rqt_graph rqt_graph
You can also simply use:
$ rqt_graph
When installing Rqt, there is an executable created for the rqt graph plugin (and some other Rqt plugins). You can use this executable, it will also create a node like with the rosrun command.
To see where is the executable:
$ which rqt_graph
/opt/ros/noetic/bin/rqt_graph
Once you’ve launched rqt_graph, you can see a new anonymous node on your graph.
$ rosnode list
/rosout
/rqt_gui_py_node_8448
Introspecting the ROS graph (with only a ROS master and Rqt graph)
When starting a ROS master, there is a node automatically created for debug purposes: rosout.
rqt_graph also starts another node (the rqt node).
In the rqt_graph window, you can visualize the rqt node created when you launched rqt graph! Seems like a nice introspection.
After starting roscore, launch rqt_graph. You’ll see nothing on the window because you haven’t created any other node and topic yet.
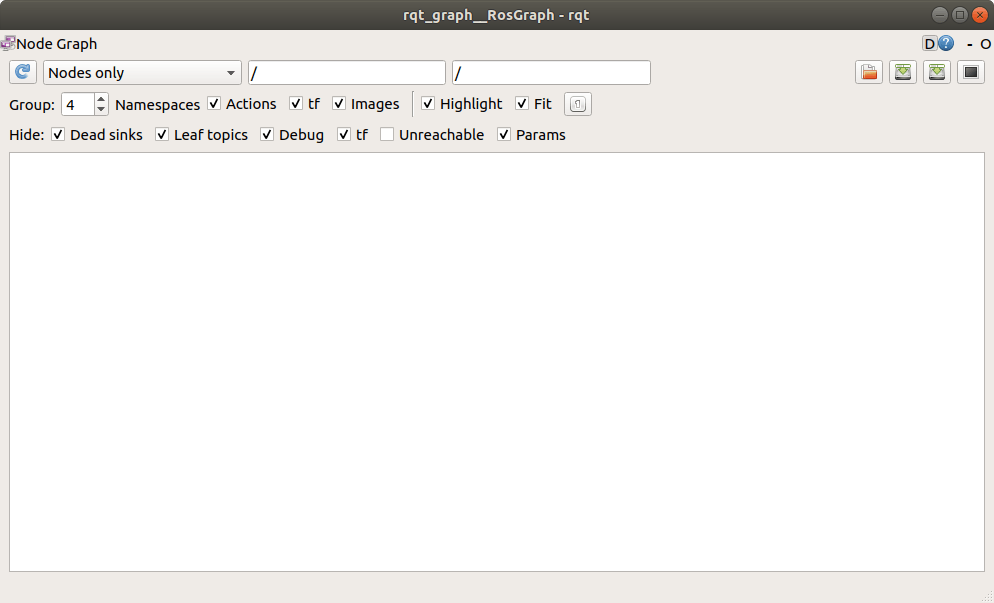
But… Where are the Rqt node and the rosout node? To see them, uncheck the “Debug” checkbox.

You can now see the 2 nodes, and also see that the Rqt node is sending data to the /rosout node, through the /rosout topic!
Those nodes – logs, rqt_graph, rqt_plot, etc – are hidden by default when you run rqt_graph. This is like that so you can focus on your own application, without too much noise. As all nodes send their logs to the /rosout node, this would quickly become impossible to read as your application grows. And this information is not the most useful information you can use when you want to debug your graph.
Use rqt_graph to debug a topic
Let’s go step by step to debug a topic with rqt_graph.
Create a simple node with a publisher
Create a Python file in which you start a node and a topic.
import rospy
from std_msgs.msg import Int64

if __name__ == '__main__':
    rospy.init_node("number_publisher")
    pub = rospy.Publisher("/number", Int64, queue_size=10)

    rate = rospy.Rate(50)

    while not rospy.is_shutdown():
        pub.publish(42)
        rate.sleep()
Here we simply publish the number “42” at 50Hz.
Run this node, and start rqt_graph.
Well, nothing really special here. The node you created is displayed on the screen. And… Where is the topic? The node is publishing on the /number topic but nothing is shown here.
This is because rqt_graph will not display topics that don’t have at least one publisher and one subscriber.
If you want to see the /number topic, change the display setting from “Nodes only” to “Nodes/Topics (all)”, and uncheck “Dead sinks” and “Leaf topics”.
Add a subscriber node to the graph
Create a new Python file for a new subscriber.
import rospy
from std_msgs.msg import Int64

def callback_number(msg):
    rospy.loginfo("Received: " + str(msg.data))

if __name__ == '__main__':
    rospy.init_node("number_subscriber")
    sub = rospy.Subscriber("/number", Int64, callback_number)

    rospy.spin()
This code is very basic: there is just one subscriber listening to the /number topic. As soon as messages are received, they are printed.
Start this node, and then launch rqt_graph.
You can now visualize the communication between the /number_publisher node and the /number_subscriber node!
With this graph you can be sure that both nodes communicate together, that the data is going from the publisher to the subscriber, and that no data is coming from any other publisher on the graph. Quite obvious here with 2 nodes, but when you have 20 of them this will become quite useful.
If you want to see a more complete view – where the topic is its own entity – change the display setting from “Nodes only” to “Nodes/Topics (all)”.
Now, just for illustrating what I previously said on debug functionalities, uncheck the “Debug” checkbox.
The visualization becomes way too noisy for what we need to do. In the future make sure to disable the debug functionalities unless you absolutely need them.
More statistics on ROS topics
You can set a ROS parameter to see more info on ROS topics with rqt_graph.
$ rosparam set enable_statistics true
One important point: make sure to set this parameter before running any other node, not only rqt_graph!
To recap, here’s what you should do:
- Start roscore
- Set the enable_statistics parameter
- Start the publisher and subscriber nodes
- Start rqt_graph
Here we can see that the data is published at 50Hz, which is exactly what we did in the publisher node.
This option can be really useful if you think that a ROS topic bandwidth is not what it’s supposed to be. For example, you could be publishing some data at 500Hz, and see that in fact the publishing frequency is more about 430Hz, which means: you have some work to do!
Real life example: visualize Turtlesim graph
Let’s use an existing ROS package, Turtlesim, to see what it looks like to debug a real life application.
Start the following in the order, each in a different terminal:
roscorerosrun turtlesim turtlesim_noderosrun turtlesim turtle_teleop_keyrqt_graph
Set the settings as I did on the screenshot so you can have a complete view of the 2 nodes and 3 topics.
You can see that the teleop_turtle node is sending velocity commands to the turtlesim node through the /turtle1/cmd_vel topic. And the turtlesim node is publishing the current post of the turtle1 on the /turtle1/pose topic. With the graph displayed, you can guess all that in less than 10 seconds, without knowing the node at all!
Note that you can easily visualize namespaces in rqt_graph. All 3 topics are starting with “/turtle1”, which is specific to the first turtle we created with the turtlesim_node.
Let’s spawn a second turtle. Open a terminal and execute:
$ rosservice call /spawn "x: 0.0
y: 0.0
theta: 0.0
name: 'turtle2'"
(press Tab after “/spawn” so the message structure will automatically appear. You can just use the arrow keys to change the name parameter, and press ENTER)
In the rqt_graph window, press the “refresh” button.
Great! You can see how the turtlesim node handles the 2 turtles. And thanks to the namespace grouping, you can clearly differentiate topics used for turtle1 and topics used for turtle2.
Conclusion
Rqt graph will be useful in many ways when you develop with ROS.
You will be able to quickly see the big picture for projects you don’t know or projects of yours that grow a lot. You will have information on what data is coming from where, and is going where.
rqt_graph will spare you some headaches when debugging your application. Now take some time to experiment with some projects you’ve already developed, or existing open source ROS projects you can find on the Internet!
→ In the rqt plugins family, also see: rqt_plot which will help you visualize data published on a topic.